For the final project in the Data Analytics and Visualization bootcamp, we worked in groups of 4–5 people to combine all of the tools and skills learned in the six-month course to analyze a dataset of our choice using machine learning, then visualize the results.
Our team chose to analyze flight delay data from the Hartsfield-Jackson Atlanta International Airport (ATL) using a logistic regression model to predict if flights would be delayed based on historical trends.
We chose ATL because it is the busiest airport in the world and would be able to provide large amounts of data while allowing us to limit the dataset’s variables to prevent large variables from impacting the results. Our dataset was further narrowed by only analyzing data from the first 8 months of 2022 and limiting our analysis to seven airlines:
- “Full Service” airlines: American Airlines, Delta Airlines, and United Airlines
- “Low Cost” airlines: JetBlue and Southwest
- “Ultra-Low Cost” airlines: Frontier and Spirit
Ultimately, the “BIG QUESTION” we wanted to answer with our analysis is if the cost of an airline was directly related to its on-time probability.
Tools Used
Excel

POSTGRES

python

pandas

tableau
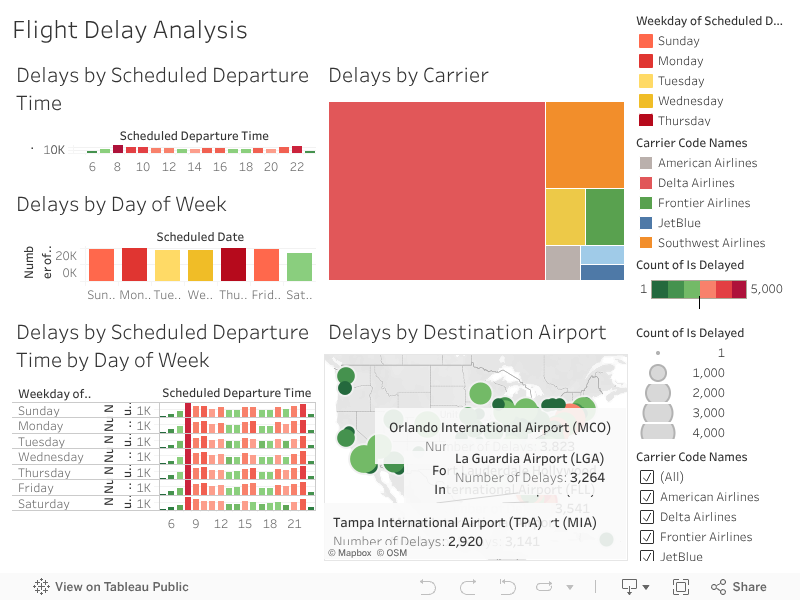
Analysis and Visualizations
Delays by destination airport

On-Time Probability by Carrier
Carrier |
Delays |
Total Flights |
On-Time |
|---|---|---|---|
| American Airlines | 572 | 3,577 | 84.01% |
| Delta Airlines | 18,319 | 102,520 | 82.13% |
| United Airlines | 389 | 1,717 | 77.34% |
| JetBlue | 339 | 1,043 | 67.50% |
| Southwest Airlines | 3,217 | 15,094 | 78.69% |
| Frontier Airlines | 1,044 | 3,042 | 65.68% |
| Spirit Airlines | 1,086 | 4,315 | 74.83% |
On-Time Probability by Category
Interactive Tableau Dashboard
Google Slides presentation
Related Projects

